If you read my last (and the only) blogpost and loaded Statsbomb Free Data into BigQuery, you probably want do something cool it instead of just leave it waiting on the cloud. And since Statsbomb just released Classics Data Pack 1, I decided to finally clean my script and finalize this blogpost (took me a month). Don’t know what else to say so I will just paste some code.
library(bigrquery)
library(rjson)
library(tidyverse)
library(ggthemes)
library(zoo)
library(grid)
library(gridExtra)
library(viridis)

bq_auth(path = "../creds/sa.json")
project = "deductive-motif-114121"
Loading packages, standard. Then I show bq_auth function where my service account json is. Adulting 101: authenticating with service account > authentication with web browser and personal google account.
Wall of text below are 3 SQL queries.
query = 'WITH  base as (SELECT id, team.name team ,match_id,player.name sub_out,period, TIME_DIFF(timestamp,TIME "00:00:00", microsecond) as minute,index, substitution.replacement.name sub_in	,
substitution.outcome.name reason	,shot.statsbomb_xg
FROM `deductive-motif-114121.statsbomb.free_data`
WHERE match_id in (2302764,3750200,3750201,18235,18236,18237,18240,18241,18242,18243,18244) AND period < 5
),

real_base as (
select distinct * except(statsbomb_xg,team, team1),
team1 as team,
team as realteam,
if(NOT team=team1,  null,statsbomb_xg ) as statsbomb_xg,
if(team=team1, null, statsbomb_xg) as opp_xg from (
select base.*, max(team)  over (partition by match_id) team1 from base
union all
select base.*, min(team) over (partition by match_id) from base)

),

real_times as (
SELECT *  except(endof_previous)  ,SUM(endof_previous) OVER(PARTITION BY match_id order by period asc) endof_previous
FROM (
select match_id,period+1 as period, max(minute) + 1 endof_previous FROM  real_base
group by 1,2)
),

fixed  as (
select * except( endof_previous,minute), if(period>1, minute+endof_previous,minute) minute from real_base LEFT JOIN real_times using(match_id,period)
),

subs as (select match_id,team, minute, IF(team=realteam,CONCAT(reason,":\\nin: ",sub_in, "\\nout: ", sub_out ),null) sub  from fixed
where reason IS NOT NULL
),
aggr as (
select match_id,team, minute,sum(statsbomb_xg) as xg, sum(opp_xg) as opp_xg from fixed
group by 1,2,3
),

joinback as (
SELECT * FROM aggr left join subs USING(minute,match_id,team)
),
windows as (
select * except(sub),sub as old_sub,
LAST_VALUE(sub IGNORE NULLS) OVER ( PARTITION BY match_id,team,	sub_id ORDER BY match_id,team,	sub_id , minute  desc ROWS BETWEEN CURRENT ROW AND  UNBOUNDED FOLLOWING) AS sub
from (
select * ,
IF(max(SUB is not null) OVER (partition by match_id,team), 0, -1) +
sum(if(SUB is not null,1,0)) OVER (PARTITION BY match_id,team order by match_id,team,minute ROWS BETWEEN UNBOUNDED PRECEDING AND CURRENT ROW )  sub_id
FROM joinback)
)

SELECT * EXCEPT(minute),(minute - IFNULL(lag(minute) OVER (PARTITION BY match_id, team order by sub_id),0))/60000000 time, minute/60000000 as lasts_to,
ifnull(lag(minute) OVER (PARTITION BY match_id, team order by sub_id),0)/60000000 event_minute   FROM (
select match_id,team, sub_id, IFNULL(sub, "Starting 11") sub,max(minute) minute,sum(xg) xg, sum(opp_xg) opp_xg from windows
group by 1,2,3,4)
'

query2 = 'WITH  base as (SELECT  team.name team ,match_id,period,
TIME_DIFF(timestamp,TIME "00:00:00", microsecond) as minute,shot.statsbomb_xg ,
IF(shot.outcome.name="Goal" or shot.outcome.name= "Own Goal For", "Goal", "No Goal") goal,
shot.outcome.name as outcome_name
FROM `deductive-motif-114121.statsbomb.free_data`
WHERE  match_id in (2302764,3750200,3750201,18235,18236,18237,18240,18241,18242,18243,18244)
AND period < 5
),
real_times as (
SELECT *  except(endof_previous)  ,SUM(endof_previous) OVER(PARTITION BY match_id order by period asc) endof_previous
FROM (
select match_id,period+1 as period, max(minute) + 1 endof_previous FROM  base
group by 1,2)
),

fixed  as (
select * except( endof_previous,minute,outcome_name), if(period>1, minute+endof_previous,minute) minute from base LEFT JOIN real_times using(match_id,period)
where  (statsbomb_xg is not null or outcome_name= "Goal")
)

select * except(period,minute), minute/60000000 event_minute from fixed '

query3 = "
SELECT match_id, match_date,home_score, away_score, home_team.home_team_name, away_team.away_team_name ,competition.competition_name FROM `deductive-motif-114121.statsbomb.matches`
where match_id in (2302764,3750200,3750201,18235,18236,18237,18240,18241,18242,18243,18244)

"
First query gets us substitution data and formats it the right way (right means it can be used in R). There is a lot of things happening here: converting timestamp to microseconds (even though it’s called minute…), calculating time since start of the game instead of start of the half, defining who replaced who/whom (idc), splitting match into periods between subs. Table in BQ is about 1GB. Downloaded datasets 0.03MB. And this is why you need to learn SQL.
#IDS of Champions League finals - 2302764,3750200,3750201,18235,18236,18237,18240,18241,18242,18243,18244

job = bq_project_query( query=query, use_legacy_sql = FALSE,x=project)
data=bq_table_download(job)
data$xg <- data$xg %>% replace_na(0)
data$opp_xg = data$opp_xg %>% replace_na(0)
df <- data %>% arrange(match_id,team,sub_id) %>%
  group_by(match_id,team) %>%
  mutate(xg_per_min=xg/time,
         roll_sum =rollapplyr(xg, 1000, sum, partial = TRUE),
         roll_time=rollapplyr(time, 1000, sum, partial = TRUE),
         roll_time2 = lag(roll_time, default = 0),
         xg_diff = xg-opp_xg ) %>% filter(match_id==2302764)


job2 = bq_project_query( query=query2, use_legacy_sql = FALSE,x=project)
data2=bq_table_download(job2)
df2 <- data2 %>% mutate(x=0) %>%  filter(match_id==2302764)

job3 = bq_project_query( query=query3, use_legacy_sql = FALSE,x=project)
data3=bq_table_download(job3)
df3 <- data3 %>%  filter(match_id==2302764)
Time to get data into R and do some processing. First of all we need to replace nulls with 0, to make aggregations work. Then we need to calculate xg_per, minute, rolling sums and xg differance for every time mark (defined by shot or sub). Lastly we filter data for only match_id we are interested in.
p1 <-
  ggplot() +
  geom_bar(data=df,aes(x=team,y=time, fill=xg_per_min),position="stack",stat="identity",width =0.75) +
  coord_flip()  +
  theme_few() +
  scale_fill_gradient(name = "xg per min",low = "#94ce98", high = "#064e0a")  + theme(legend.title = element_blank()) +
  ggtitle("xG Per min for substitution period")  +
  xlab("")+
  ylab("Minute") +
  scale_y_continuous(breaks = seq(0, 90, by = 15)) +
  geom_text(aes(x=team,label=round(xg_per_min,3), y=event_minute), color="white",
            nudge_x= 0.25,
            hjust=-.2,vjust=1,
            data=df[df$sub_id %% 2 == 0,]) +
  geom_text(aes(x=team,label=sub, y=roll_time2), color="black", size = 3,
            nudge_x= 0.25,nudge_y= -.25,
            hjust=1,vjust=1,
            data=df[df$sub_id %% 2 == 0 & !df$sub=="Starting 11",])+
  geom_text(aes(x=team,label=round(xg_per_min,3), y=event_minute), color="white",
            nudge_x= -0.2,
            vjust=1,hjust=-.2,
            data=df[df$sub_id %% 2 == 1,]) +
  geom_text(aes(x=team,label=sub, y=roll_time2), color="black", size = 3,
            nudge_x= -0.10,nudge_y= -.25,
            hjust=1,vjust=1,
            data=df[df$sub_id %% 2 == 1 & !df$sub=="Starting 11",]) +
  geom_point(data=df2,aes(y=event_minute,x=team, size=statsbomb_xg, shape=goal), alpha=0.4, position = position_nudge(x = -0.5)) +
  scale_color_manual(values=c("blue","red"))+
  scale_size_continuous(range = c(4,10))


p2 <- ggplot() +
  geom_bar(data=df, aes(x=team,y=time, fill=xg_diff), position="stack",stat="identity",width =0.75) +
  coord_flip() +
  theme_few() +
  scale_fill_gradientn(name = "xg_diff", colours  = brewer.pal(n = 9, name = "RdBu"))  +
  theme(legend.title = element_blank()) +
  ggtitle("xG diff for substitution period")+
  xlab("") +
  ylab("Minute")+
  scale_y_continuous(breaks = seq(0, 90, by = 15)) +
  geom_text(aes(x=team,label=round(xg_diff,3), y=event_minute), color="black",
            nudge_x= 0.25,
            hjust=-.2,vjust=1,
            data=df[df$sub_id %% 2 == 0,]) +
  geom_text(aes(x=team,label=sub, y=roll_time2), color="black", size = 3,
            nudge_x= 0.25,nudge_y= -.25,
            hjust=1,vjust=1,
            data=df[df$sub_id %% 2 == 0 & !df$sub=="Starting 11",])+
  geom_text(aes(x=team,label=round(xg_diff,3), y=event_minute), color="black",
            nudge_x= -0.2,
            vjust=1,hjust=-.2,
            data=df[df$sub_id %% 2 == 1,]) +
  geom_text(aes(x=team,label=sub, y=roll_time2), color="black", size = 3,
            nudge_x= -0.10,nudge_y= -.25,
            hjust=1,vjust=1,
            data=df[df$sub_id %% 2 == 1 & !df$sub=="Starting 11",]) +
  geom_point(data=df2,aes(y=event_minute,x=team, size=statsbomb_xg, shape=goal), alpha=0.4, position = position_nudge(x = -0.5)) +
  scale_color_manual(values=c("blue","red")) +
  scale_size_continuous(range = c(4,10))
Here is some ggplot magic, probably the most interesting part of this post.
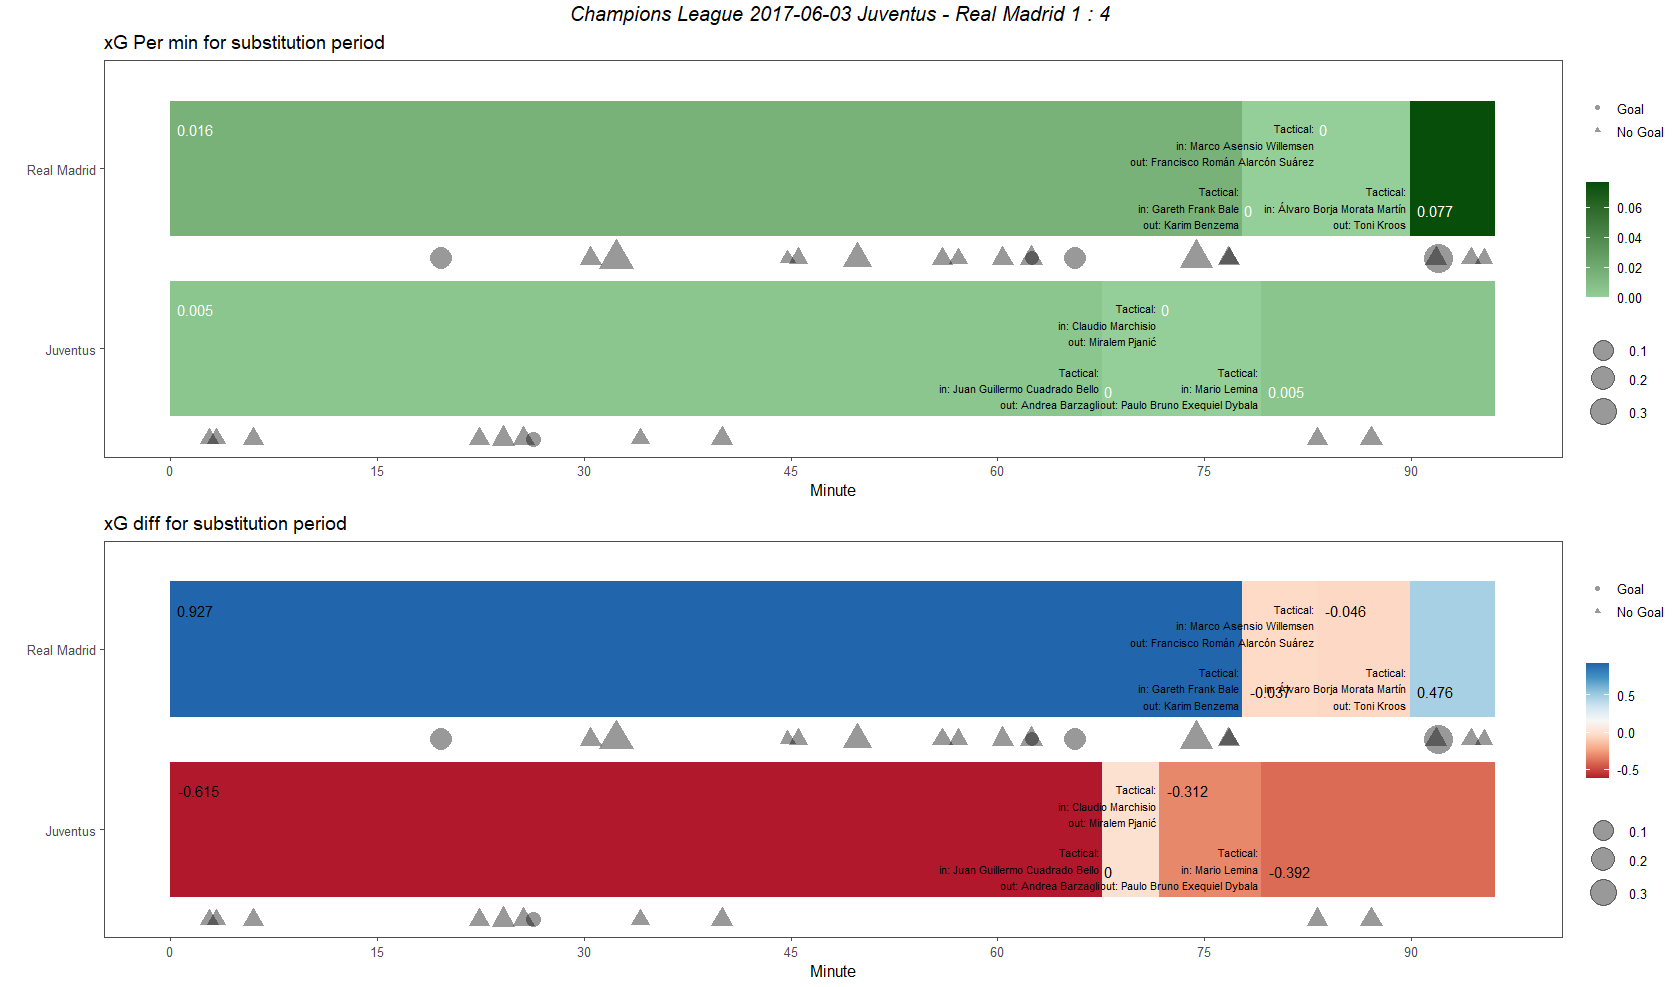
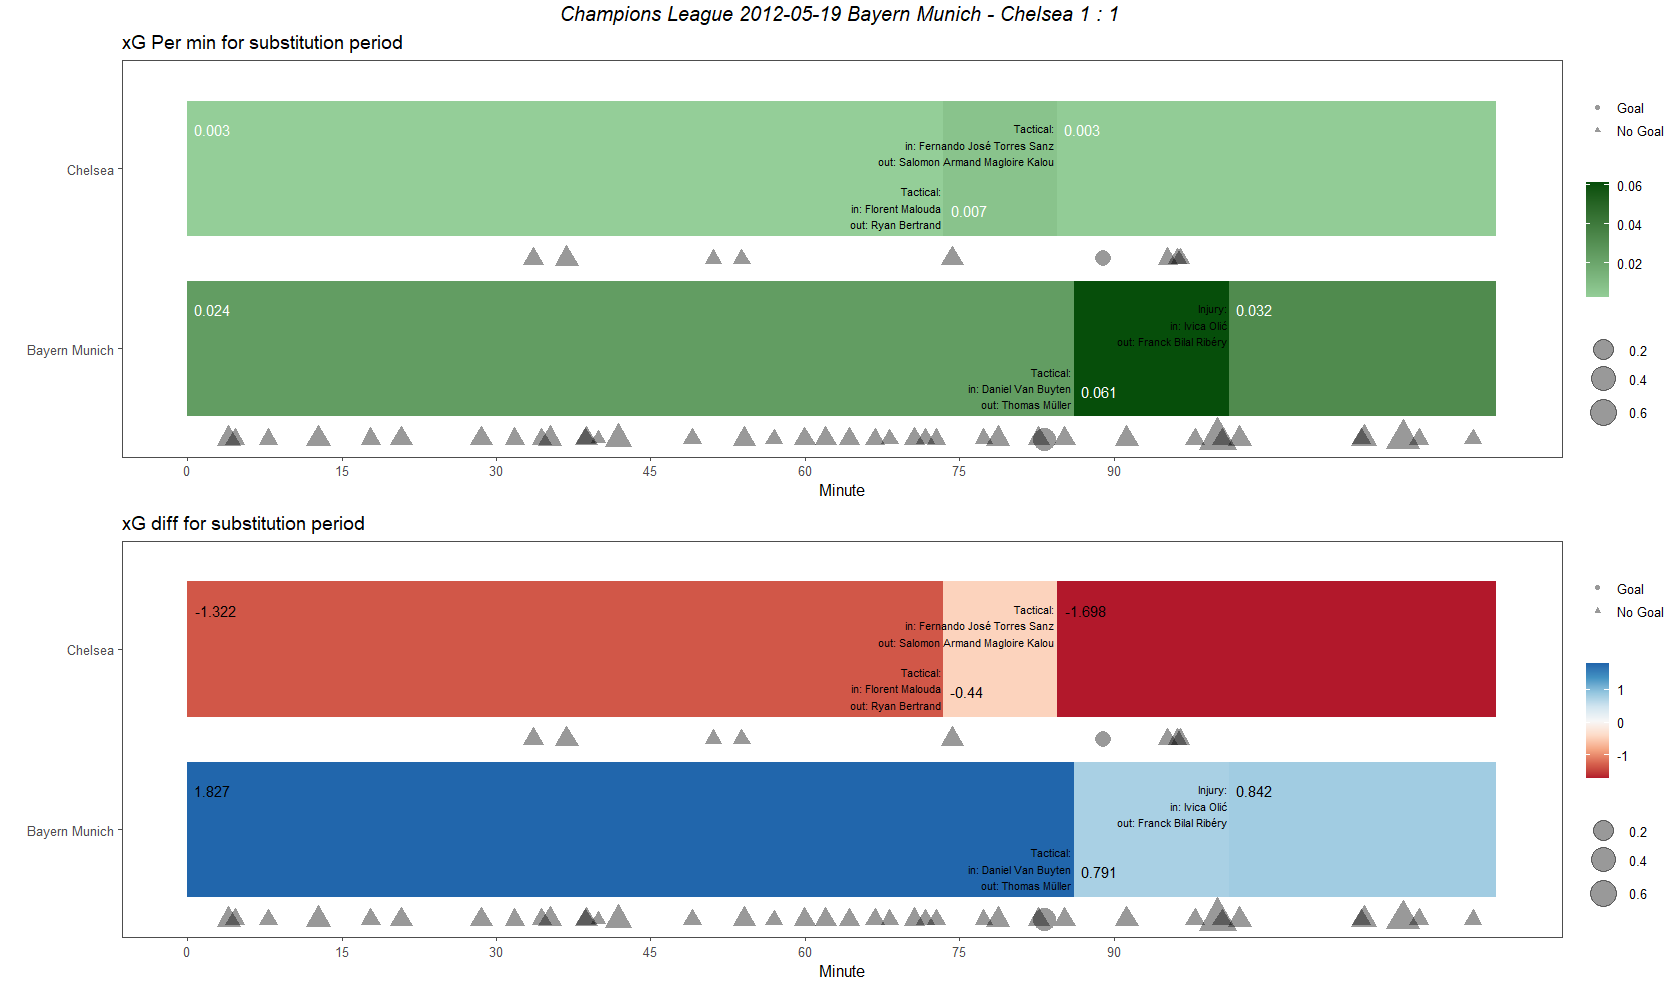
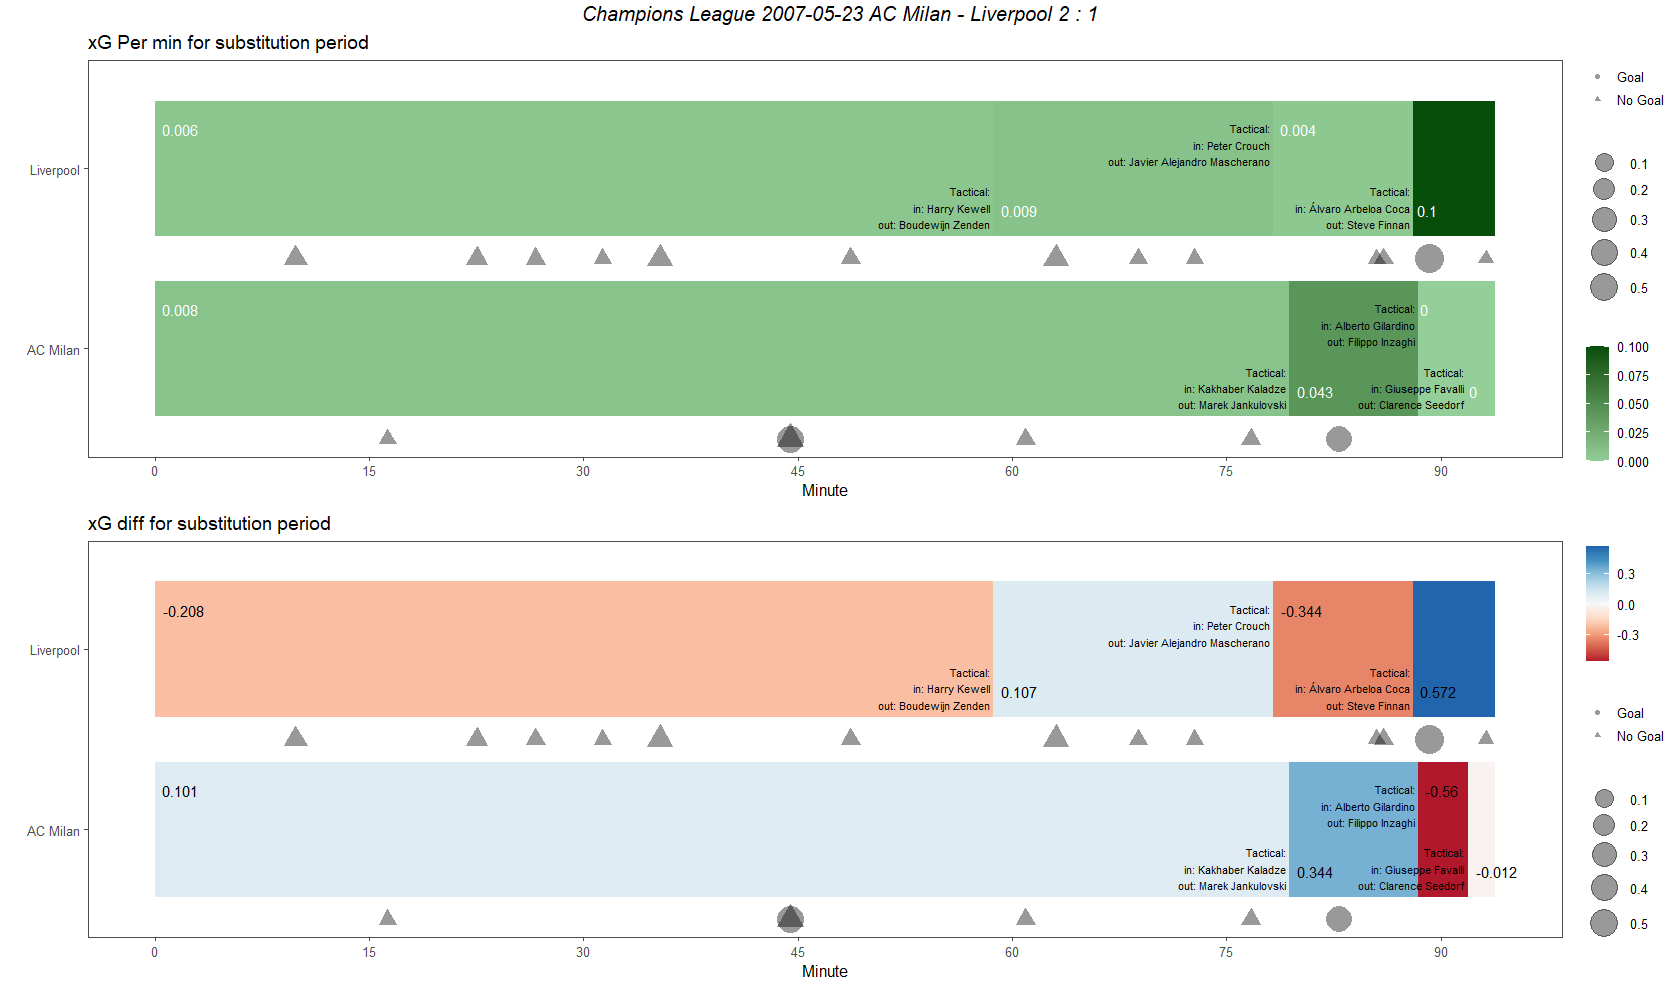
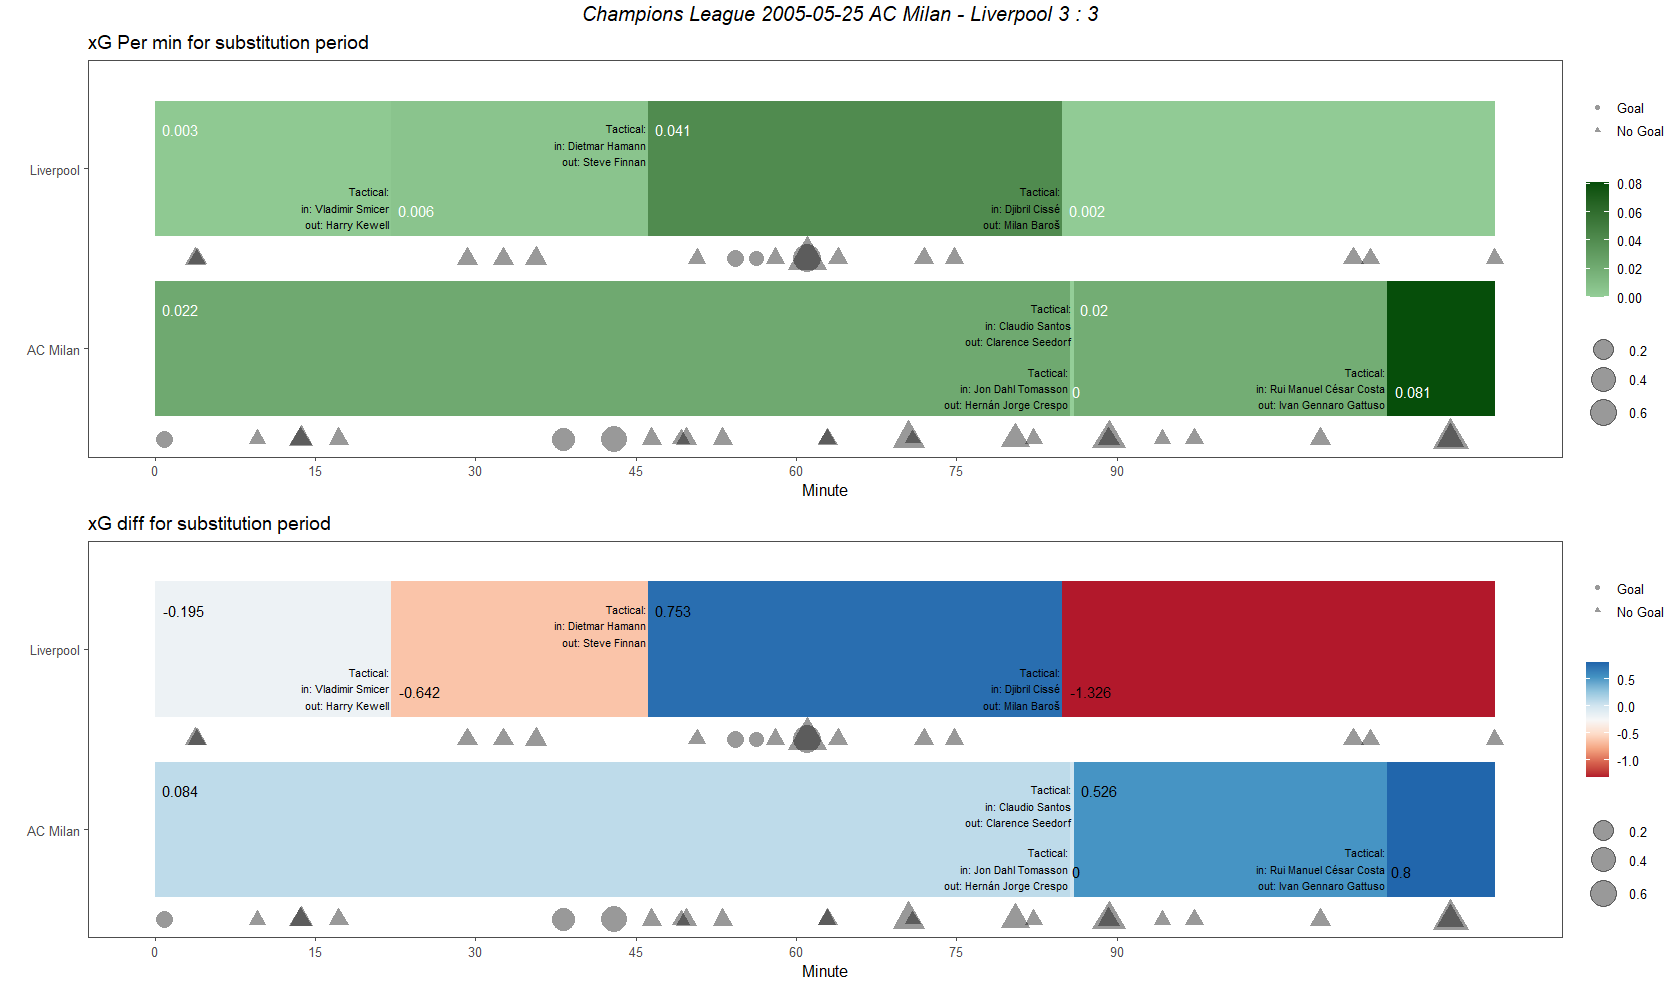
title <- paste(df3$competition_name,df3$match_date, df3$home_team_name,"-", df3$away_team_name, df3$home_score,":",df3$away_score,sep=" ")

grid.arrange(ggplotGrob(p1), ggplotGrob(p2),
             top = textGrob(paste0(title),gp=gpar(fontsize=15,font=3)))
Finally merging everything into one image.
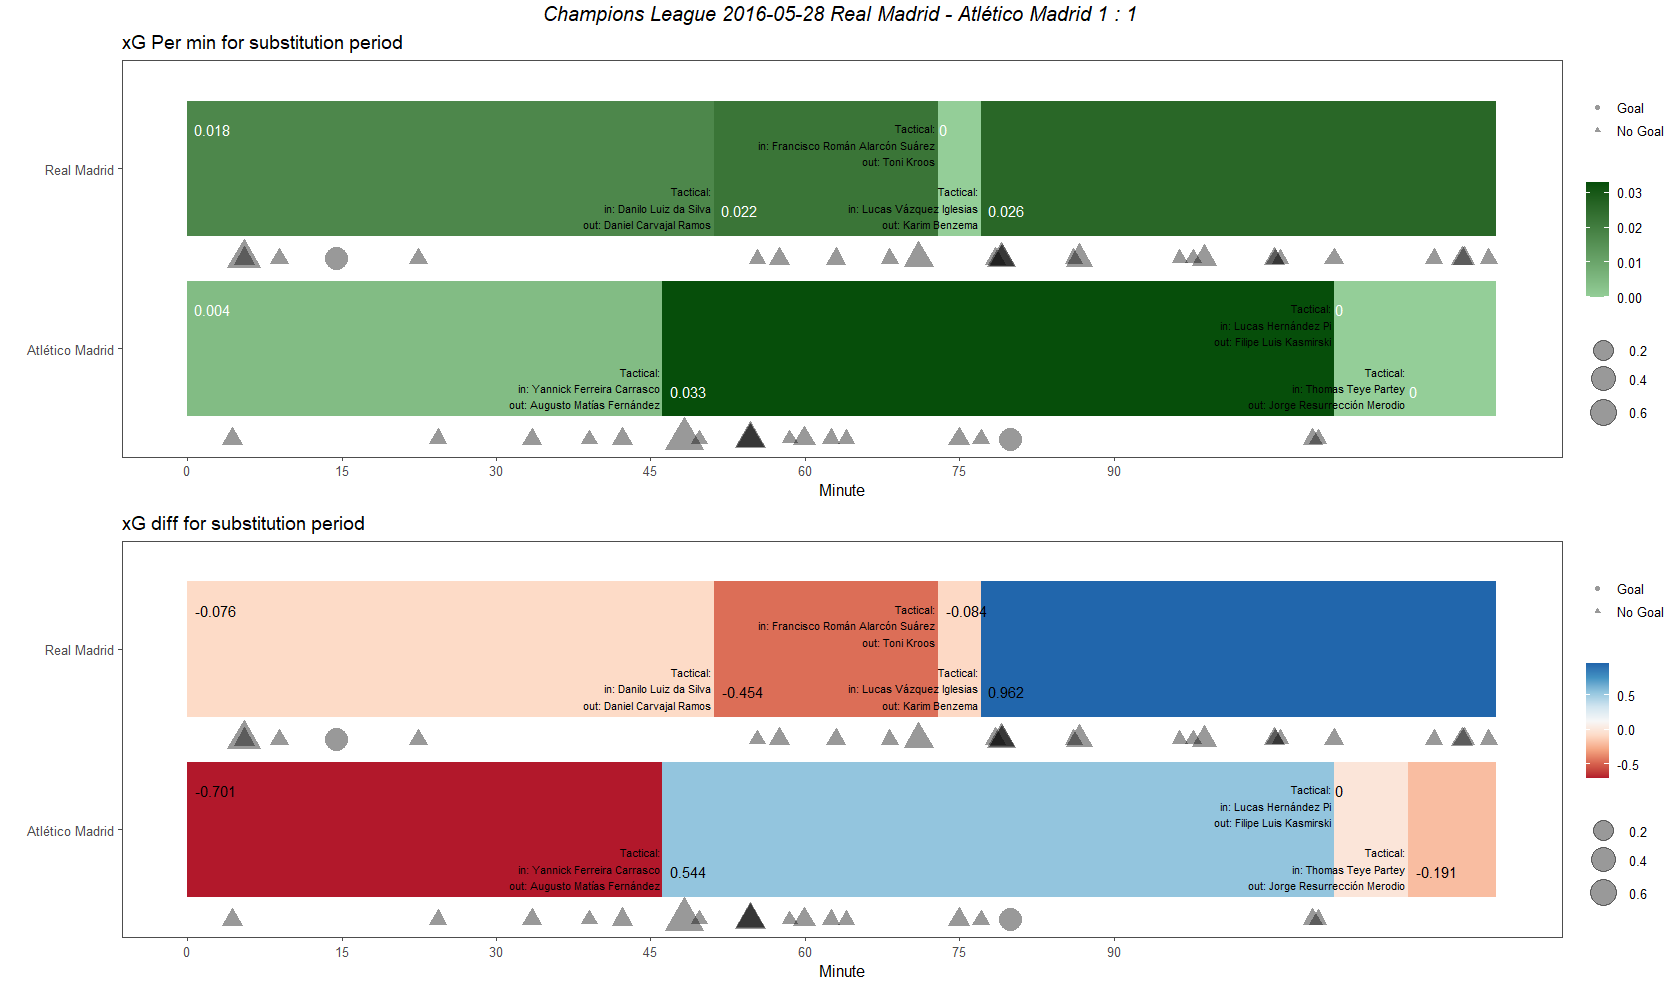
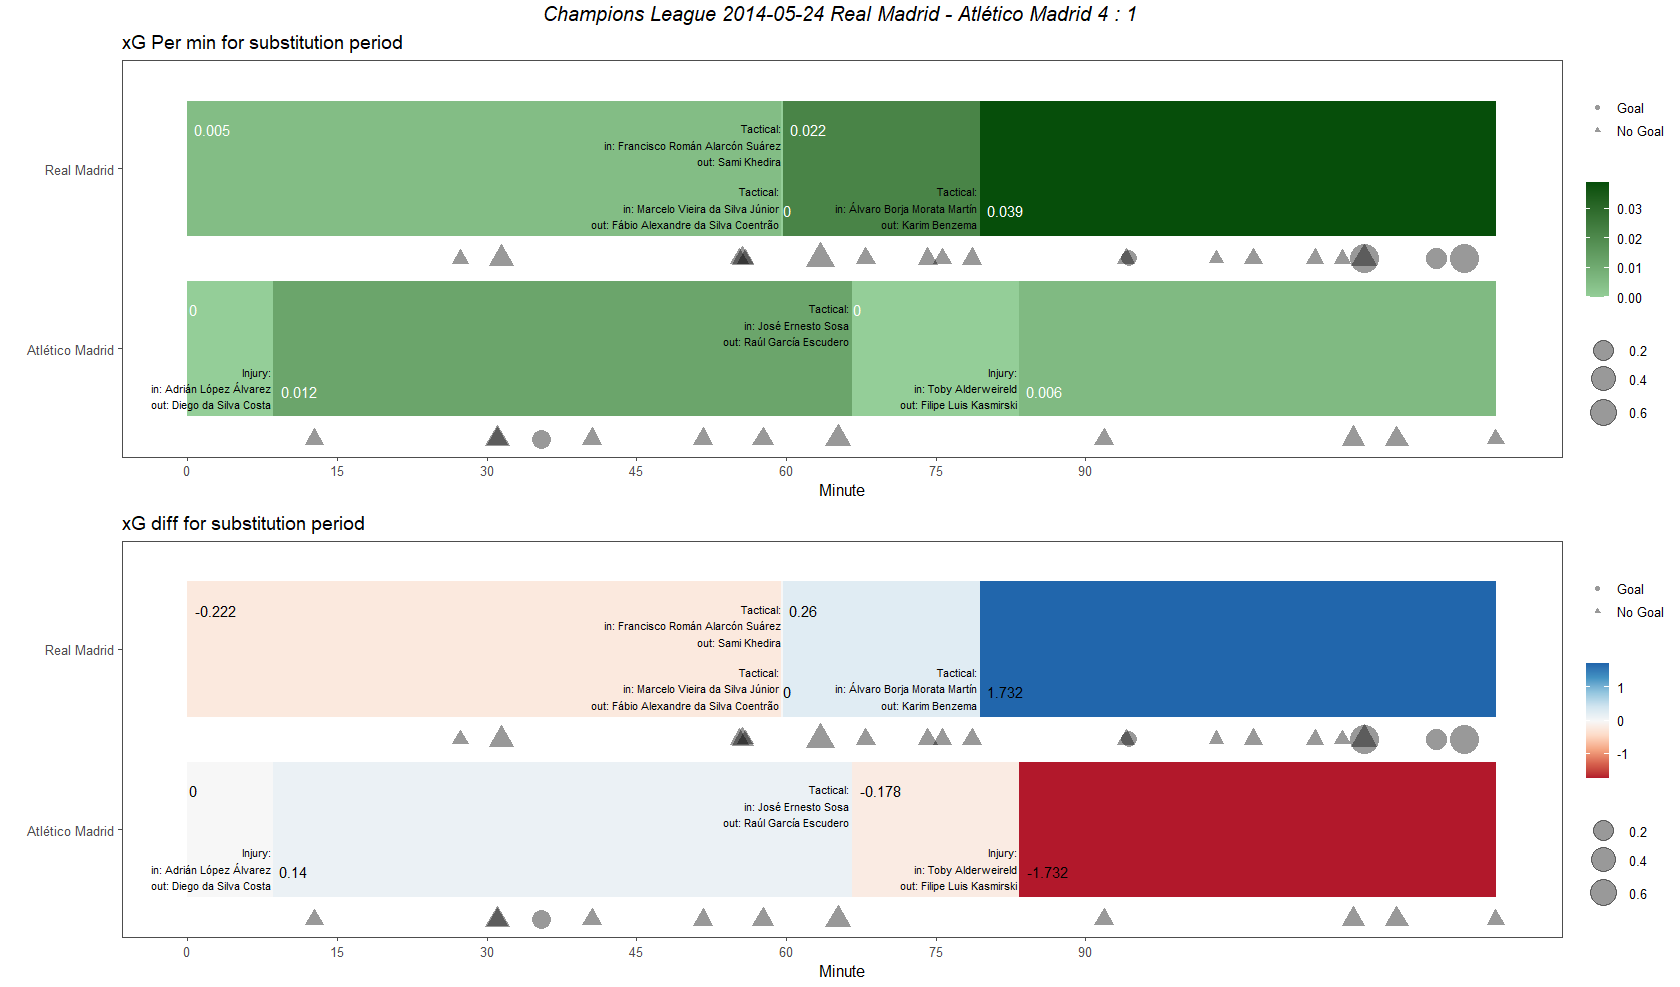
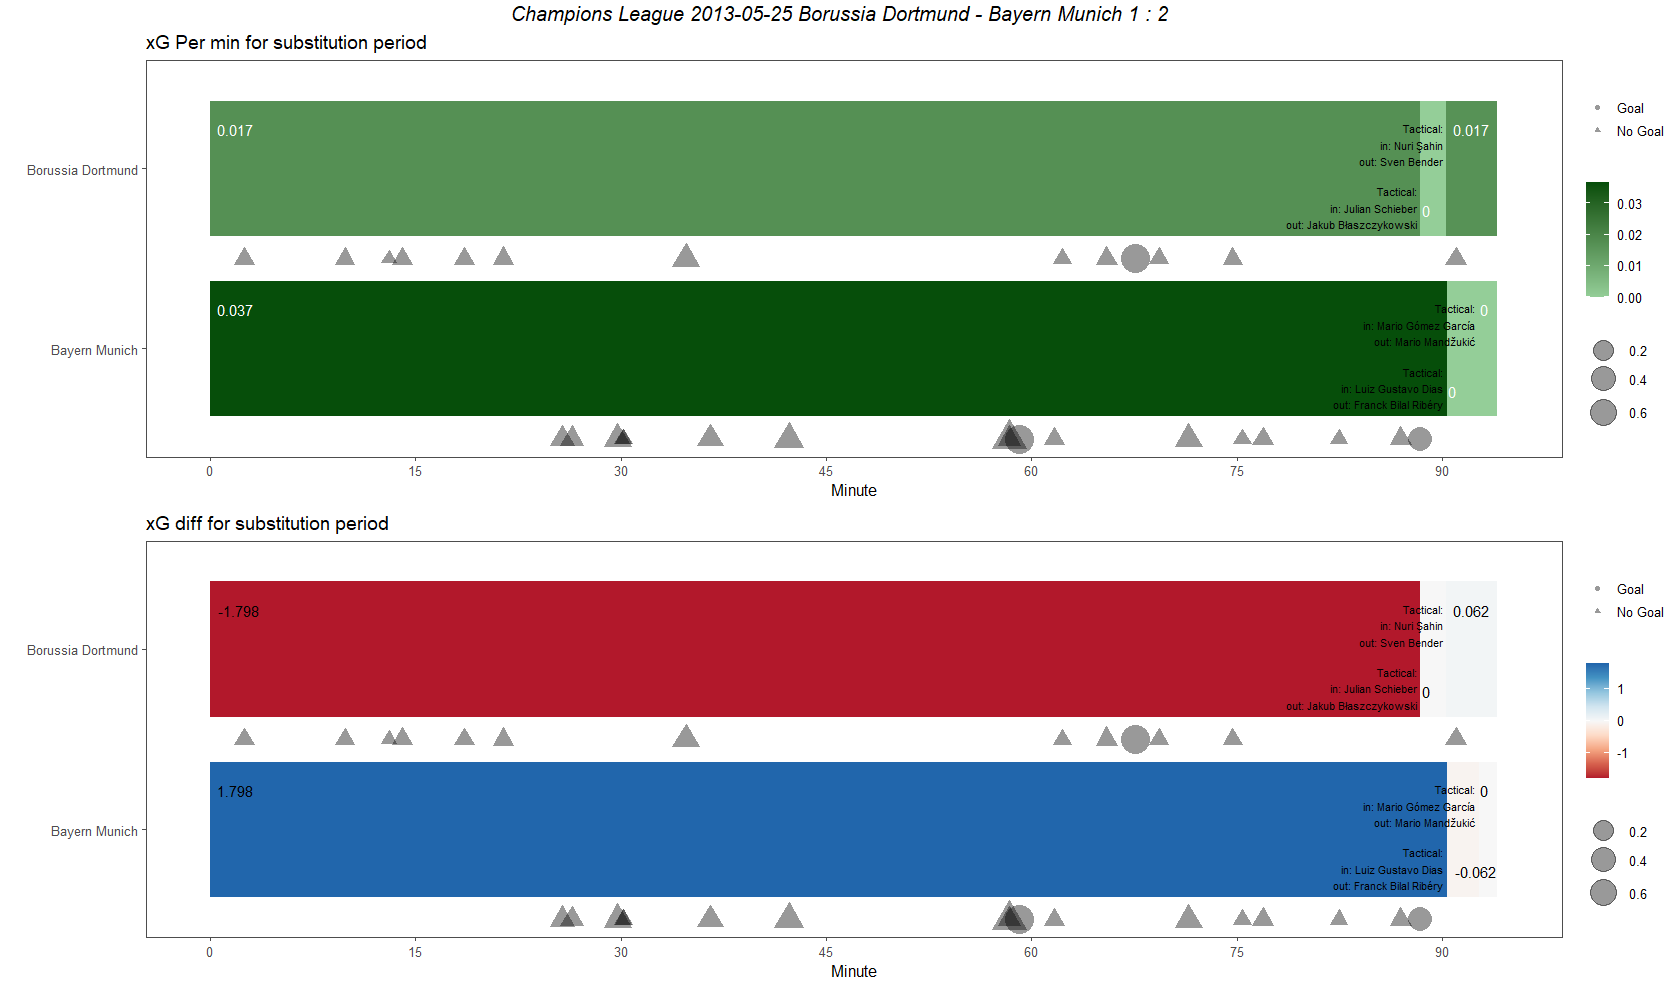
And here are expected outputs. Bar charts representing time played, grouped by times when subs were made. Color scale shows you how good team was in certain period (dark green and blue are good, light green and red are bad). Below bars are timelines of shots. Shape represents result of the shot, size its quality (xG).
As you can see some finals are missing, I will add them when data will be available.
Sorry for not making background dark…
Some of the best substitutions:
- Yanniick Carrasco for Augusto Fernandez in 2016
- Alvaro Morata for Karim Benzema in 2014
- And Obviously Dietier Hamann for Steve Finnan in 2005 (ironically Liverpool was completly dominated in extra time after Ancelotti made his subs)