burn that excel spreadsheet
burn that excel spreadsheet
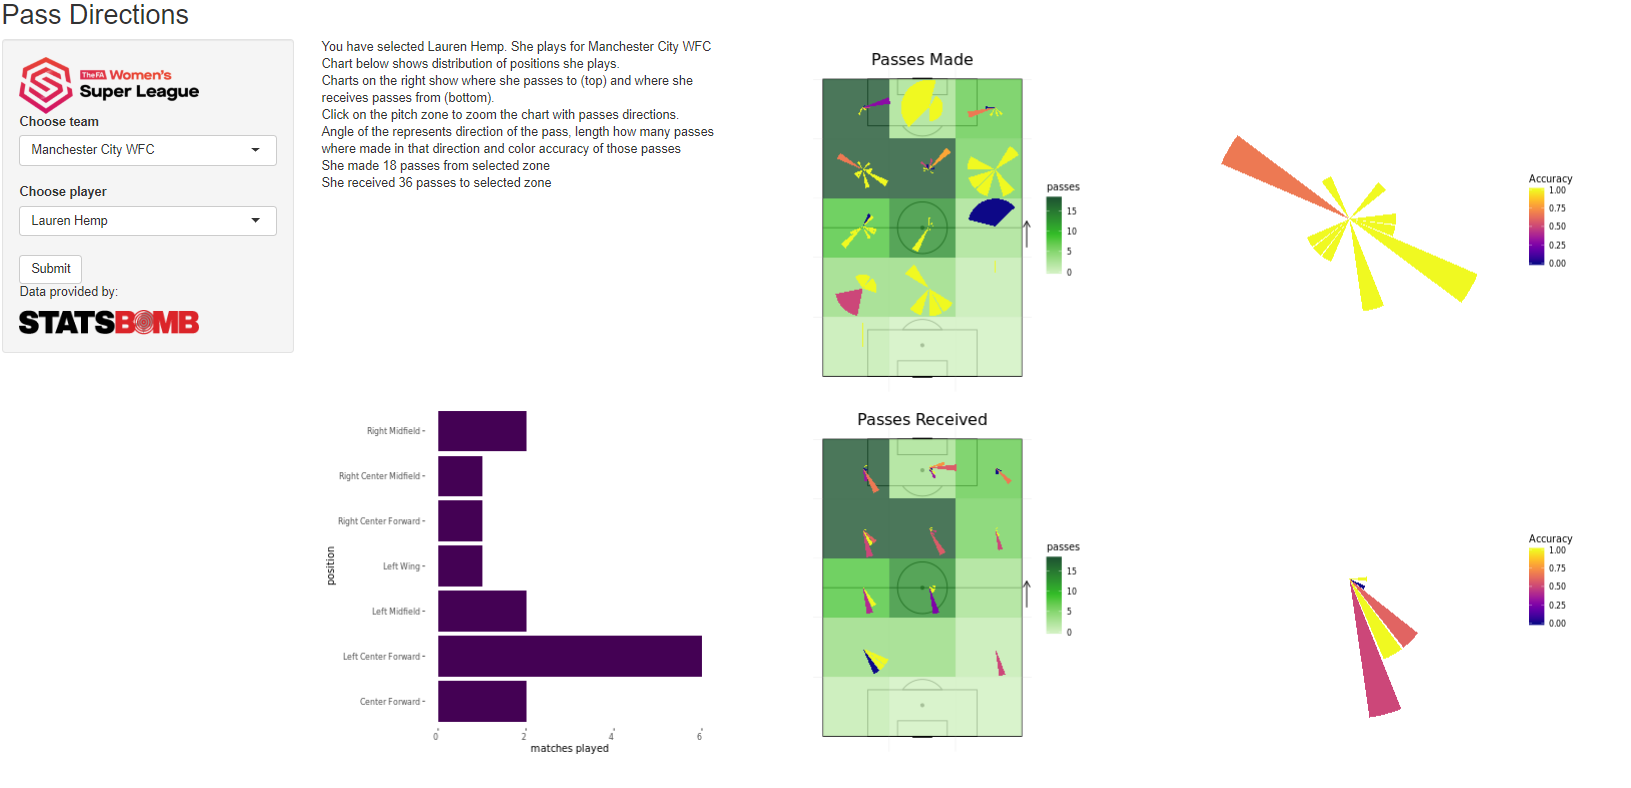
Shiny dashboard created based on Statsbomb free data. Allows you to explore passes tendencies of WSL players.
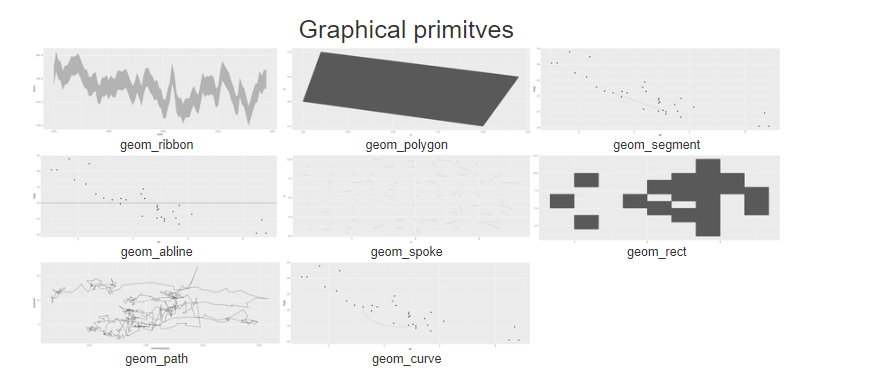
I created this dashboard to help all R learners to undestand how to plot beautiful/useful charts using the most popular vizualization package ggplot2. It won’t teach you how to write a code, but definitely will show you how ggplot2 geoms look like, and how manipulating their arguments changes visualization. Few scrolls below you can find list of covered geoms and example of what they plot.